RS Aggarwal Solutions Class 9 Chapter 14 Statistics Solution
EXERCISE 14B
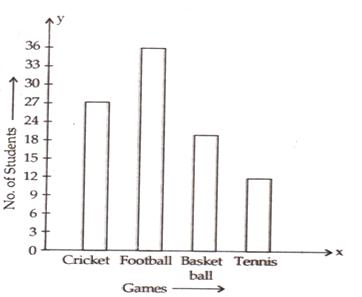
Question 1:
Take the various types of games along the x-axis and the number of students along
the y-axis.
Along the y-axis, take 1 small square=3 units.
All the bars should be of same width and same space should be left between the
consecutive bars.
Now we shall draw the bar chart, as shown below:
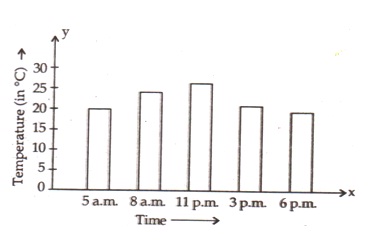
Question 2:
Take the timings along the x-axis and the temperatures along the y-axis.
Along the y-axis, take 1 small square=5 units.
All the bars should be of same width and same space should be left between the
consecutive bars.
Now we shall draw the bar chart, as shown below:
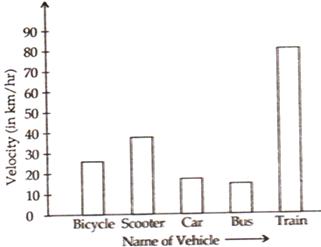
Question 3:
Take the modes of transport along the x-axis and the velocities along the
y-axis.
Along the y-axis, take 1 small square=10 units.
All the bars should be of same width and same space should be left between the
consecutive bars.
Now we shall draw the bar chart, as shown below:
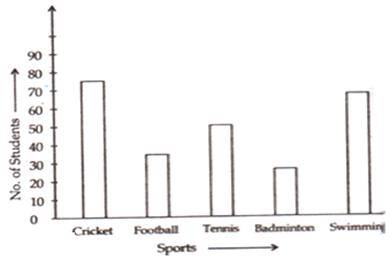
Question 4:
Take the various types of sports along the x-axis and the number of students along
the y-axis.
Along the y-axis, take 1 small square=10 units.
All the bars should be of same width and same space should be left between the
consecutive bars.
Now we shall draw the bar chart, as shown below:
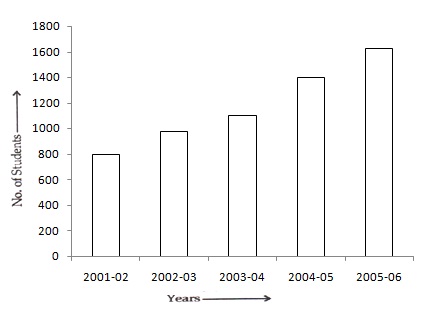
Question 5:
Take the academic year along the x-axis and the number of students along the
y-axis.
Along the y-axis, take 1 big division =200 units.
All the bars should be of same width and same space should be left between the
consecutive bars.
Now we shall draw the bar chart, as shown below:
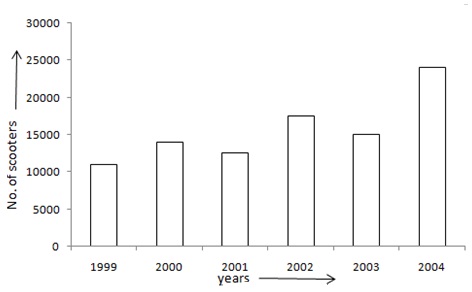
Question 6:
Take the years along the x-axis and the number of scooters along the y-axis.
Along the y-axis, take 1 big division =5000 units.
All the bars should be of same width and same space should be left between the
consecutive bars.
Now we shall draw the bar chart, as shown below:
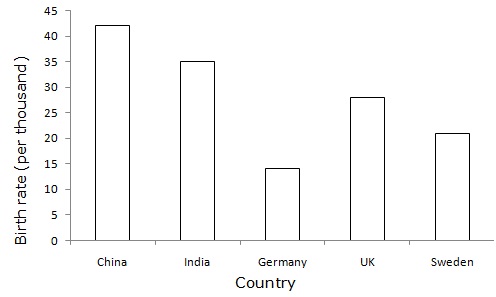
Question 7:
Take the countries along the x-axis and the birth rate (per thousand) along the
y-axis.
Along the y-axis, take 1 big division = 5 units.
All the bars should be of same width and same space should be left between the
consecutive bars.
Now we shall draw the bar chart, as shown below:
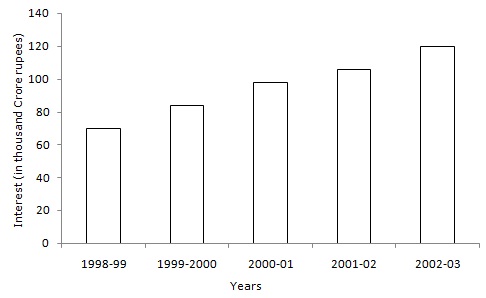
Question 8:
Take the years along the x-axis and the Interest (in Thousand Crore Rupees) along
the y-axis.
Along the y-axis, take 1 big division =20 units.
All the bars should be of same width and same space should be left between the
consecutive bars.
Now we shall draw the bar chart, as shown below:
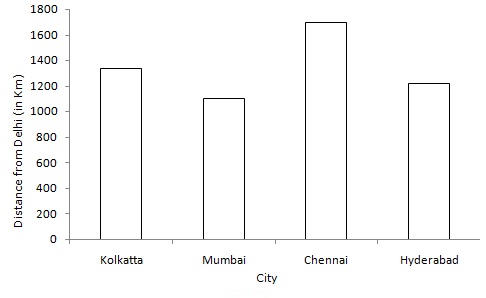
Question 9:
Take city along the x-axis and distance from Delhi (in Km) along the y-axis.
Along the y-axis, take 1 big division =200 units.
All the bars should be of same width and same space should be left between the
consecutive bars.
Now we shall draw the bar chart, as shown below:
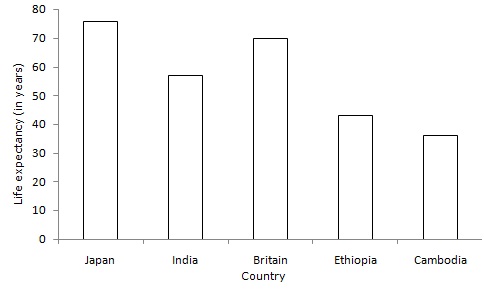
Question 10:
Take Country along the x-axis and Life expectancy (in years) along the y-axis.
Along the y-axis, take 1 big division =10 units.
All the bars should be of same width and same space should be left between the
consecutive bars.
Now we shall draw the bar chart, as shown below:
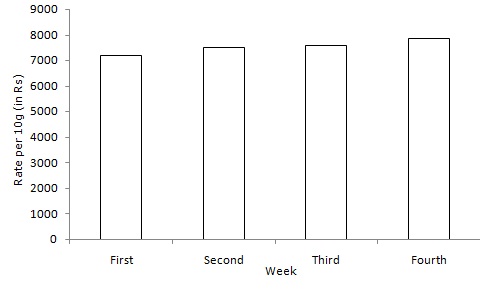
Question 11:
Take the number of week along the x-axis and rate per 10gm (in Rs.) along the
y-axis.
Along the y-axis, take 1 big division =1000 units.
All the bars should be of same width and same space should be left between the
consecutive bars.
Now we shall draw the bar chart, as shown below:
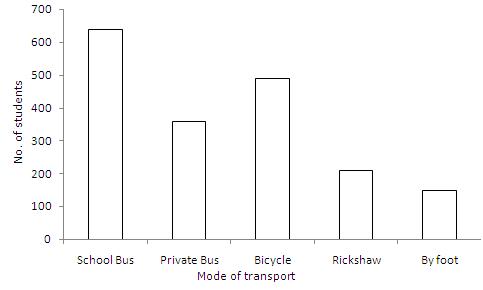
Question 12:
Take themode of transport along the x-axis and the number of students along the
y-axis.
Along the y-axis, take 1 big division = 100 units.
All the bars should be of same width and same space should be left between the
consecutive bars.
Now we shall draw the bar chart, as shown below:
Question 13:
(i) The bar graph shows the marks obtained by a student in various subject in an
examination.
(ii) The student is very good in mathematics.
(iii) He is poor in Hindi
(iv) Average marks = \(\frac { (60+35+75+50+60) }{ 5 } =\frac { 280 }{ 5 } =56 \)