RS Aggarwal Solutions Class 9 Chapter 14 Statistics Solution
EXERCISE 14A
Question 1:
Statistics is a branch of science which deals with the collection, presentation,
analysis and interpretation of numerical data.
Question 2:
Fundamental characteristics of statistics :
(i) It deals only with the numerical data.
(ii) Qualitative characteristic such as illiteracy, intelligence, poverty etc cannot
be measured numerically
(iii) Statistical inferences are not exact.
Question 3:
Primary data: Primary data is the data collected by the investigator himself with a
definite plan in his mind. These data are very accurate and reliable as these being
collected by the investigator himself.
Secondary Data: Secondary data is the data collected by a person other than the
investigator.
Secondary Data is not very reliable as these are collected by others with purpose
other than the investigator and may not be fully relevant to the investigation.
Question 4:
(i)Variate : Any character which can assume many different values is called a
variate.
(ii) Class Interval :Each group or class in which data is condensed is called a
class interval.
(iii) Class-Size : The difference between the true upper limit and the true lower
limit of a class is called class size.
(iv) Class-mark : The average of upper and lower limit of a class interval is called
its class mark.
i.e Class mark = \(\frac { upper\quad limit\quad +\quad lower\quad limit }{ 2 }
\)
(v) Class limit: Class limits are the two figures by which a class is bounded . The
figure on the left side of a class is called lower lower limit and on the right side
is called its upper limit.
(vi) True class limits : In the case of exclusive form of frequency distribution,
the upper class limits and lower class limits are the true upper limits and the true
lower limits. But in the case of inclusive form of frequency distribution , the true
lower limit of a class is obtained by subtracting 0.5 from the lower limit of the
class. And the true upper limit of the class is obtained by adding 0.5 to the upper
limit.
(vii) Frequency of a class : The number of observations falling in a class
determines its frequency.
(viii) Cumulative frequency of a class: The sum of all frequencies up to and
including that class is called , the cumulative frequency of that class.
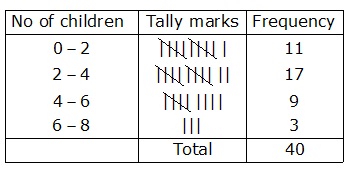
Question 5:
Minimum observation is 0 and maximum observation is 6. The classes of equal size
covering the given data are : (0-2), (2-4), (4-6) and (6-8).
Thus , the frequency distribution may be given as under:
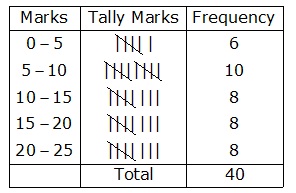
Question 6:
Minimum observation is 1 and minimum observation is 24. The classes of equal size
converging the given data are : (0-5), (5-10), (10-15), (15-20), (20-25)
Thus, the frequency distribution may be given as under :
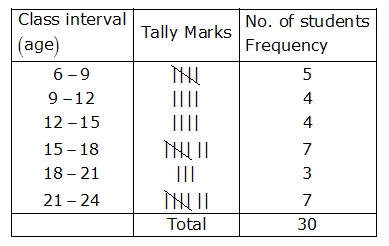
Question 7:
Minimum observation is 6 and maximum observation is 23 .So the range is
23-6=17
The classes of equal size covering the given data are : (6-9), (9-12) , (12-15) ,
(15-18 ), (18-21), (21-24) ,
Thus the frequency distribution may be given as under :
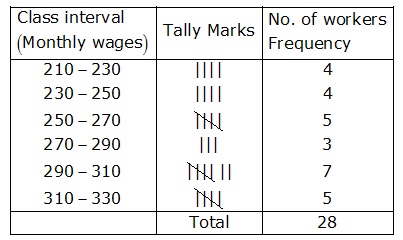
Question 8:
Minimum observation is 210 and maximum observation =320
So the range is (320-210)=110
The classes of equal size covering the given data are :
(210-230), (230-250), (250-270) , (270-290), (290-310), (310-330)
Thus the frequency distribution may be given as under :
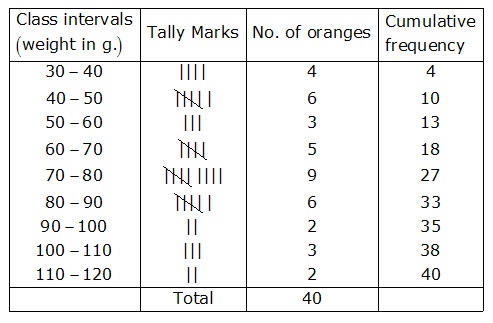
Question 9:
Minimum observation is 30 and maximum observation is 110
So, range is 100-30=80
The classes of equal size covering the given data are :
(30-40) ,(40-50) , (50-60) ,(60-70) , (70-80), (80-90),(90-100),(100-110),
(110-120)
Thus , the frequency and cumulative frequency table may be given as under :
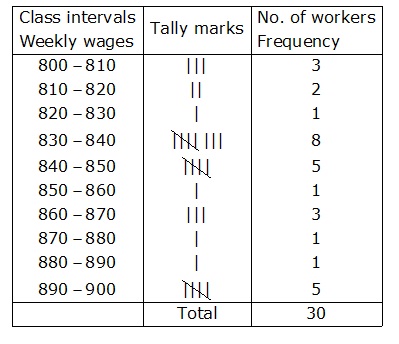
Question 10:
Minimum observations is 804 and maximum observation is 898 So, range is 898-804
=94
The class es of equal size covering the given data are :
(800-810), (810-820) , (820-830),(840-850), (850-860), (860-870), (870-880)
,(880-890), (890-900)
Thus the frequency table may be given as under :
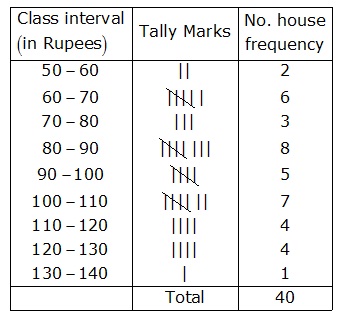
Question 11:
Minimum observation 52 and maximum observation is 130
So , The range is 130-52=78
The classes of equal size covering the given data are :
(50-60), (60-70), (70-80), (80-90), (90-100), (100-110), (110-120),
(120-130),(130-140)
Thus , the frequency table may be given as under :
Question 12:
| Age (in years) | Number of
Patients
(Frequency) |
Cumulative Frequency |
| 10 – 20 | 90 | 90 |
| 20 – 30 | 50 | 140 |
| 30 – 40 | 60 | 200 |
| 40 – 50 | 80 | 280 |
| 50 – 60 | 50 | 330 |
| 60 – 70 | 30 | 360 |
| Total | 360 |
Question 13:
|
Marks(below) |
Number of students (Cumulative Frequency) | Class Intervals |
Frequency |
|
10 |
5 | 0 – 10 | 5 |
|
20 |
12 | 10 – 20 | 12 – 5 = 7 |
|
30 |
32 | 20 – 30 | 32 – 12 = 20 |
| 40 | 40 | 30 – 40 |
40 – 32 = 8 |
|
50 |
45 |
40 – 50 | 45 – 40 = 5 |
| 60 | 48 | 50 – 60 |
48 – 45 = 3 |
| Total | 48 |
Question 14:
|
Marks(below) |
Number of students (Cumulative Frequency) | Class Intervals |
Frequency |
|
10 |
17 | 0 – 10 | 17 |
|
20 |
22 | 10 – 20 | 22 – 17 = 5 |
|
30 |
29 | 20 – 30 | 29 – 22 = 7 |
| 40 | 37 | 30 – 40 |
37 – 29 = 8 |
|
50 |
50 |
40 – 50 | 50 – 37 = 13 |
| 60 | 60 | 50 – 60 |
60 – 50 = 10 |
| Total | 60 |
Question 15:
|
Marks(below) |
Number of students (Cumulative Frequency) | Class Intervals |
Frequency |
|
More than 60 |
0 | More than 60 | 0 |
|
More than 50 |
16 | 50 – 60 | 16-0=16 |
|
More than 40 |
40 | 40 – 50 | 40-16=24 |
| More than 30 | 75 | 30 – 40 |
75-40=35 |
|
More than 20 |
87 |
20 – 30 | 87-75=12 |
| More than 10 | 92 | 10 – 20 |
92-87=5 |
|
More than 0 |
100 | 0 – 10 | 100-92=8 |
| Total | 100 |